Wednesday, November 11, 2009

creating user defined metric for monitoring job durations

In this production system there are some number of database jobs (not Scheduler Jobs) running on different time intervals. Some of these jobs are running on every five minutes while the other running on every hour. There are also some batch jobs scheduled to be run on every night.

There was a custom developed Oracle9i script to monitor every job duration and warn the DBA if there is a broken job or a job with more than three hours of duration. As this database is upgraded to 10g now we are able to use "Notification Rules" and "User Defined Metrics" to monitor the database jobs. This approach will supply us the historical data collection and also the standart notification method with all other EM Console messages. We also will not need to compile this old package on all of the production databases instead the User Defined Metric can be applied to all of the databases with including the metric in the monitoring templates.

"User Defined Metrics" page can be reached from a link at the bottom of the main page of the Enterprise Manager DB Console just under the Related Links section shown below.


When you click to the "User-Defined Metrics" link on the main page of the EM DB Console, User Defined Metrics are listed.


You can manage the your own custom metrics by using the right top buttons. You can simply select on of the User Defined Metric and click on the "View Data" Button.


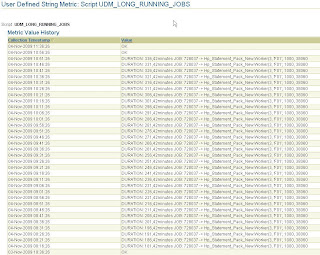
When you click on the "View Data" button the Metric Value History of the specified Metric can be seen.


Again from the main page of the "User-Defined Metrics" you can click on the "Create" Button to create a brand new User Defined Metric. There is a sample new metric creation page values which i used for the metric UDM_LONG_RUNNING_JOBS. This metric calculates the job durations and notified the DBA if there are jobs which have more than 180 Minutes of duration time.
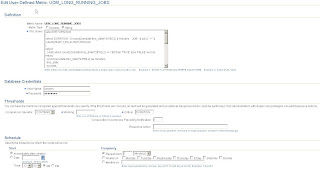


This metric has a string value and collection SQL of the metric is as follows. If the return value contains "DURATION" string then EM Console pretends as it exceeds a Critical Treshold and throws a Critical Alert. Metric collection runs every 5 minutes. At least 1 occurance is sufficient to send a Critical Alert.


select RETURN from
(
select 'DURATION: ' || round((sysdate-this_date)*24*60,2) || 'minutes JOB: ' || job || ' -> ' || substr(WHAT,1,50) as RETURN from
(
select
CASE when round((sysdate-this_date)*24*60,2) >= 5 then 'TRUE' else 'FALSE' end as return,
round((sysdate-this_date)*24*60,2) as minutes,
this_date,
sysdate,
job,
schema_user,
last_date,
next_date,
total_time,
interval,
what
from
dba_jobs
where
broken='N' and
LAST_DATE is not NULL
order by
next_date asc
)
where return='TRUE'
group by round((sysdate-this_date)*24*60,2),job,substr(WHAT,1,50)
UNION
select 'OK' as RETURN from dual
)
where rownum=1


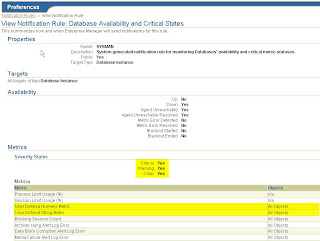
The last thing is, if you want an email notification when a Critical Alert triggered by this User Defined Metric you should add this metric to the notification rules which is in the preferences page of the EM Grid Control.


Wednesday, November 4, 2009

what is datapump doing in my system tablespace

One of our datapump export jobs was continously ending unsuccessfully with the following error.


Job "SYSTEM"."SYS_EXPORT_FULL_06" stopped due to fatal error at 01:42:36


I decided to investigate the log file and seems there is a lack of available space in the system tablespace and the datapump job goes in to the resumable wait and after 2 hours (which is a default resumable timeout value) fails. The error lines as follows.


ORA-39171: Job is experiencing a resumable wait.
ORA-01653: unable to extend table SYSTEM.SYS_EXPORT_FULL_06 by 128 in tablespace SYSTEM


I think I should investigate the root cause of the problem. I want to know what objects are using the SYSTEM tablespace first. Listing the largest segments would be handy.


select 
segment_name, bytes/1024/1024 as MB from dba_segments 
where 
tablespace_name='SYSTEM' 
order by bytes desc; 

/*
SEGMENT_NAME                MB
------------                --
SYS_LOB0001316900C00039$$   3072
SYS_LOB0001344581C00039$$   3054
SYS_LOB0001343732C00039$$   3029
SYS_LOB0001320071C00039$$   2375
SYS_LOB0001344712C00039$$   1216
C_OBJ#                      816
I_COL1                      745
I_COL2                      484
*/


What are these SYSTEM generated segments?? They are allocating lots of space here.


select 
owner, segment_name, segment_type, tablespace_name, bytes/1024/1024 as MB 
from 
dba_segments 
where 
segment_name = 'SYS_LOB0001344712C00039$$'

/*
OWNER   SEGMENT_NAME                SEGMENT_TYPE    TABLESPACE_NAME MB
-----   ------------                ------------    --------------- --
SYSTEM  SYS_LOB0001344712C00039$$   LOBSEGMENT      SYSTEM          1216
*/

select 
owner, table_name, column_name, segment_name 
from 
dba_lobs 
where segment_name = 'SYS_LOB0001344712C00039$$';

/*
OWNER   TABLE_NAME          COLUMN_NAME     SEGMENT_NAME
-----   ----------          -----------     ------------
SYSTEM  SYS_EXPORT_FULL_05  XML_CLOB        SYS_LOB0001344712C00039$$
*/ 


Now it is clear. Datapump jobs locked themselves because of the tables created by the jobs itself (master tables of the datapump jobs). I think when the jobs couldnt ended up with success (or failed unexpectedly), datapump cannot tidy up its behind. Let me see the datapump jobs existing in the database.


select * from dba_datapump_jobs;
select * from dba_datapump_sessions;

/*
OWNER_NAME  JOB_NAME            OPERATION       JOB_MODE        STATE
----------  --------            --------        --------        -----       
SYSTEM      SYS_EXPORT_FULL_04  EXPORT          FULL            NOT RUNNING 
SYSTEM      SYS_EXPORT_FULL_05  EXPORT          FULL            NOT RUNNING
*/


I think that is what i guess. The jobs are not running and there no sessions attached to them. I decided to drop the tables to obtain some free space to the SYSTEM tablespace.


drop table SYSTEM.SYS_EXPORT_FULL_04;

select 
segment_name, bytes/1024/1024 as MB from dba_segments 
where 
tablespace_name='SYSTEM' 
order by bytes desc; 

select to_char(trunc(sum(bytes)/1024/1024),'99,999,999') as FREE_MB from dba_free_space where tablespace_name='SYSTEM';

/*
FREE_MB
------
14,644
*/


Now it is OK. 20Gb of SYSTEM tablespace is now has more than 14Gb of free space. Let me investigate the problem further for not to fall into the same problem again. When i check the available space of filesystem which datapump job works at, there seems a little space left on the disks. Then it is possible to be an unexpected job failure.

Meanwhile, As far as i know if you are using datapump in parallel mode you should obtain more than one dumpfile. You can attach %U parameter at the end of the file then datapump will automatically create the number of the files for every parallel thread. But in this case there is only one file is specified and 6 parallel thread is trying to be used. I dont know if this is the real cause of the problem but i will definitely remove the parallel clause from the parameter file.

There is another option here that i didnt tried before which is compression. I am not sure of this but may be the compression operation of the METADATA is done in the system tablespace? Or somehow needs some space in the database. It look silly because if the compression is done in an algorithm like this it is not really efficient, but i still dont want to use this parameter so also removed the compression parameter from the parameter file.


full=y
compression=METADATA_ONLY
directory=DATA_PUMP_DIR
dumpfile=fusion_export_full.exp
logfile=fusion_export_full.log
parallel=6
userid=system/@